
使用 ptrace,第二部分
在本文的第一部分 [LJ,2002 年 11 月],我们了解了如何使用 ptrace 来跟踪系统调用和更改系统调用参数。在本文中,我们将研究高级技术,例如设置断点和将代码注入到正在运行的程序中。调试器使用这些方法来设置断点和执行调试处理程序。与第一部分一样,本文中的所有代码都是特定于 i386 架构的。
在第一部分中,我们在调用 ptrace(PTRACE_TRACEME, ..) 后将要跟踪的进程作为子进程运行。如果您只想查看进程如何进行系统调用并跟踪程序,这将足够了。如果您想跟踪或调试已在运行的进程,则应使用 ptrace(PTRACE_ATTACH, ..)。
当使用要跟踪的 pid 调用 ptrace(PTRACE_ATTACH, ..) 时,它大致相当于进程调用 ptrace(PTRACE_TRACEME, ..) 并成为跟踪进程的子进程。跟踪的进程会收到 SIGSTOP 信号,因此我们可以像往常一样检查和修改该进程。在我们完成修改或跟踪后,我们可以通过调用 ptrace(PTRACE_DETACH, ..) 让跟踪的进程自行继续运行。
以下是一个小型示例跟踪程序的代码
int main()
{   int i;
    for(i = 0;i < 10; ++i) {
        printf("My counter: %d\n", i);
        sleep(2);
    }
    return 0;
}
将程序保存为 dummy2.c。编译并运行它
gcc -o dummy2 dummy2.c
./dummy2 &
现在,我们可以使用下面的代码附加到 dummy2
#include <sys/ptrace.h>
#include <sys/types.h>
#include <sys/wait.h>
#include <unistd.h>
#include <linux/user.h> /* For user_regs_struct
etc. */
int main(int argc, char *argv[])
{ pid_t traced_process;
struct user_regs_struct regs;
long ins;
if(argc != 2) {
printf("Usage: %s <pid to be traced>\n",
argv[0], argv[1]);
exit(1);
}
traced_process = atoi(argv[1]);
ptrace(PTRACE_ATTACH, traced_process,
NULL, NULL);
wait(NULL);
ptrace(PTRACE_GETREGS, traced_process,
NULL, ®s);
ins = ptrace(PTRACE_PEEKTEXT, traced_process,
regs.eip, NULL);
printf("EIP: %lx Instruction executed: %lx\n",
regs.eip, ins);
ptrace(PTRACE_DETACH, traced_process,
NULL, NULL);
return 0;
}
上面的程序只是简单地附加到一个进程,等待它停止,检查其 eip(指令指针)并分离。要在跟踪的进程停止后注入代码,请使用 ptrace(PTRACE_POKETEXT, ..) 和 ptrace(PTRACE_POKEDATA, ..)。
调试器如何设置断点?通常,它们用陷阱指令替换要执行的指令,以便当跟踪的程序停止时,跟踪程序(调试器)可以检查它。一旦跟踪程序继续跟踪进程,它将替换原始指令。这是一个例子
#include <sys/ptrace.h>
#include <sys/types.h>
#include <sys/wait.h>
#include <unistd.h>
#include <linux/user.h>
const int long_size = sizeof(long);
void getdata(pid_t child, long addr,
char *str, int len)
{ char *laddr;
int i, j;
union u {
long val;
char chars[long_size];
}data;
i = 0;
j = len / long_size;
laddr = str;
while(i < j) {
data.val = ptrace(PTRACE_PEEKDATA, child,
addr + i * 4, NULL);
memcpy(laddr, data.chars, long_size);
++i;
laddr += long_size;
}
j = len % long_size;
if(j != 0) {
data.val = ptrace(PTRACE_PEEKDATA, child,
addr + i * 4, NULL);
memcpy(laddr, data.chars, j);
}
str[len] = '\0';
}
void putdata(pid_t child, long addr,
char *str, int len)
{ char *laddr;
int i, j;
union u {
long val;
char chars[long_size];
}data;
i = 0;
j = len / long_size;
laddr = str;
while(i < j) {
memcpy(data.chars, laddr, long_size);
ptrace(PTRACE_POKEDATA, child,
addr + i * 4, data.val);
++i;
laddr += long_size;
}
j = len % long_size;
if(j != 0) {
memcpy(data.chars, laddr, j);
ptrace(PTRACE_POKEDATA, child,
addr + i * 4, data.val);
}
}
int main(int argc, char *argv[])
{ pid_t traced_process;
struct user_regs_struct regs, newregs;
long ins;
/* int 0x80, int3 */
char code[] = {0xcd,0x80,0xcc,0};
char backup[4];
if(argc != 2) {
printf("Usage: %s <pid to be traced>\n",
argv[0], argv[1]);
exit(1);
}
traced_process = atoi(argv[1]);
ptrace(PTRACE_ATTACH, traced_process,
NULL, NULL);
wait(NULL);
ptrace(PTRACE_GETREGS, traced_process,
NULL, ®s);
/* Copy instructions into a backup variable */
getdata(traced_process, regs.eip, backup, 3);
/* Put the breakpoint */
putdata(traced_process, regs.eip, code, 3);
/* Let the process continue and execute
the int 3 instruction */
ptrace(PTRACE_CONT, traced_process, NULL, NULL);
wait(NULL);
printf("The process stopped, putting back "
"the original instructions\n");
printf("Press <enter> to continue\n");
getchar();
putdata(traced_process, regs.eip, backup, 3);
/* Setting the eip back to the original
instruction to let the process continue */
ptrace(PTRACE_SETREGS, traced_process,
NULL, ®s);
ptrace(PTRACE_DETACH, traced_process,
NULL, NULL);
return 0;
}
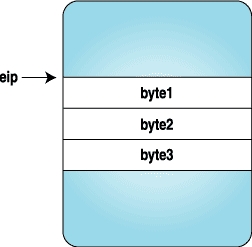
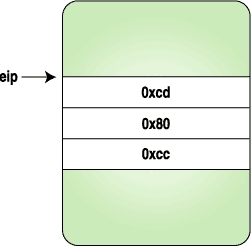
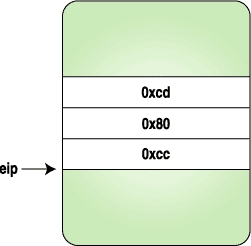
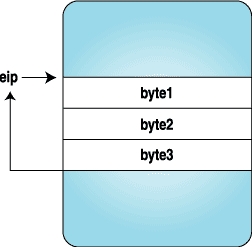
在这里,我们用陷阱指令的代码替换了三个字节,当进程停止时,我们替换了原始指令并将 eip 重置为原始位置。图 1-4 阐明了执行上述程序时指令流的外观。
既然我们清楚地了解了断点是如何设置的,那么让我们将一些代码字节注入到正在运行的程序中。这些代码字节将打印 “hello world”。
以下程序是一个简单的 “hello world” 程序,经过修改以满足我们的需求。使用以下命令编译以下程序
gcc -o hello hello.c
void main()
{
__asm__("
         jmp forward
backward:
         popl   %esi      # Get the address of
                          # hello world string
         movl   $4, %eax  # Do write system call
         movl   $2, %ebx
         movl   %esi, %ecx
         movl   $12, %edx
         int    $0x80
         int3             # Breakpoint. Here the
                          # program will stop and
                          # give control back to
                          # the parent
forward:
         call   backward
         .string \"Hello World\\n\""
       );
}
这里向后和向前跳转是为了找到 “hello world” 字符串的地址。
我们可以从 GDB 获取上述汇编的机器代码。启动 GDB 并反汇编程序
(gdb) disassemble main
Dump of assembler code for function main:
0x80483e0 <main>:       push   %ebp
0x80483e1 <main+1>:     mov    %esp,%ebp
0x80483e3 <main+3>:     jmp    0x80483fa <forward>
End of assembler dump.
(gdb) disassemble forward
Dump of assembler code for function forward:
0x80483fa <forward>:    call   0x80483e5 <backward>
0x80483ff <forward+5>:  dec    %eax
0x8048400 <forward+6>:  gs
0x8048401 <forward+7>:  insb   (%dx),%es:(%edi)
0x8048402 <forward+8>:  insb   (%dx),%es:(%edi)
0x8048403 <forward+9>:  outsl  %ds:(%esi),(%dx)
0x8048404 <forward+10>: and    %dl,0x6f(%edi)
0x8048407 <forward+13>: jb     0x8048475
0x8048409 <forward+15>: or     %fs:(%eax),%al
0x804840c <forward+18>: mov    %ebp,%esp
0x804840e <forward+20>: pop    %ebp
0x804840f <forward+21>: ret
End of assembler dump.
(gdb) disassemble backward
Dump of assembler code for function backward:
0x80483e5 <backward>:   pop    %esi
0x80483e6 <backward+1>: mov    $0x4,%eax
0x80483eb <backward+6>: mov    $0x2,%ebx
0x80483f0 <backward+11>:        mov    %esi,%ecx
0x80483f2 <backward+13>:        mov    $0xc,%edx
0x80483f7 <backward+18>:        int    $0x80
0x80483f9 <backward+20>:        int3
End of assembler dump.
我们需要从 main+3 到 backward+20 获取机器代码字节,总共 41 个字节。可以使用 GDB 中的 x 命令查看机器代码
(gdb) x/40bx main+3
<main+3>: eb 15 5e b8 04 00 00 00
<backward+6>: bb 02 00 00 00 89 f1 ba
<backward+14>: 0c 00 00 00 cd 80 cc
<forward+1>: e6 ff ff ff 48 65 6c 6c
<forward+9>: 6f 20 57 6f 72 6c 64 0a
现在我们有了要执行的指令字节。还等什么?我们可以使用与上一个示例相同的方法注入它们。以下是源代码;这里只给出了 main 函数
int main(int argc, char *argv[])
{ pid_t traced_process;
struct user_regs_struct regs, newregs;
long ins;
int len = 41;
char insertcode[] =
"\xeb\x15\x5e\xb8\x04\x00"
"\x00\x00\xbb\x02\x00\x00\x00\x89\xf1\xba"
"\x0c\x00\x00\x00\xcd\x80\xcc\xe8\xe6\xff"
"\xff\xff\x48\x65\x6c\x6c\x6f\x20\x57\x6f"
"\x72\x6c\x64\x0a\x00";
char backup[len];
if(argc != 2) {
printf("Usage: %s <pid to be traced>\n",
argv[0], argv[1]);
exit(1);
}
traced_process = atoi(argv[1]);
ptrace(PTRACE_ATTACH, traced_process,
NULL, NULL);
wait(NULL);
ptrace(PTRACE_GETREGS, traced_process,
NULL, ®s);
getdata(traced_process, regs.eip, backup, len);
putdata(traced_process, regs.eip,
insertcode, len);
ptrace(PTRACE_SETREGS, traced_process,
NULL, ®s);
ptrace(PTRACE_CONT, traced_process,
NULL, NULL);
wait(NULL);
printf("The process stopped, Putting back "
"the original instructions\n");
putdata(traced_process, regs.eip, backup, len);
ptrace(PTRACE_SETREGS, traced_process,
NULL, ®s);
printf("Letting it continue with "
"original flow\n");
ptrace(PTRACE_DETACH, traced_process,
NULL, NULL);
return 0;
}
在前面的示例中,我们将代码直接注入到正在执行的指令流中。但是,调试器可能会对这种行为感到困惑,因此让我们在进程中找到可用空间并将代码注入到那里。我们可以通过检查跟踪进程的 /proc/pid/maps 文件来找到可用空间。以下函数将找到此映射的起始地址
long freespaceaddr(pid_t pid)
{
    FILE *fp;
    char filename[30];
    char line[85];
    long addr;
    char str[20];
    sprintf(filename, "/proc/%d/maps", pid);
    fp = fopen(filename, "r");
    if(fp == NULL)
        exit(1);
    while(fgets(line, 85, fp) != NULL) {
        sscanf(line, "%lx-%*lx %*s %*s %s", &addr,
               str, str, str, str);
        if(strcmp(str, "00:00") == 0)
            break;
    }
    fclose(fp);
    return addr;
}
/proc/pid/maps 中的每一行代表进程的映射区域。 /proc/pid/maps 中的条目如下所示
map start-mapend    protection  offset     device
inode      process file
08048000-0804d000   r-xp        00000000   03:08
66111      /opt/kde2/bin/kdeinit
以下程序将代码注入到可用空间。它与之前的注入程序类似,只是可用空间地址用于保存我们的新代码。以下是 main 函数的源代码
int main(int argc, char *argv[])
{ pid_t traced_process;
struct user_regs_struct oldregs, regs;
long ins;
int len = 41;
char insertcode[] =
"\xeb\x15\x5e\xb8\x04\x00"
"\x00\x00\xbb\x02\x00\x00\x00\x89\xf1\xba"
"\x0c\x00\x00\x00\xcd\x80\xcc\xe8\xe6\xff"
"\xff\xff\x48\x65\x6c\x6c\x6f\x20\x57\x6f"
"\x72\x6c\x64\x0a\x00";
char backup[len];
long addr;
if(argc != 2) {
printf("Usage: %s <pid to be traced>\n",
argv[0], argv[1]);
exit(1);
}
traced_process = atoi(argv[1]);
ptrace(PTRACE_ATTACH, traced_process,
NULL, NULL);
wait(NULL);
ptrace(PTRACE_GETREGS, traced_process,
NULL, ®s);
addr = freespaceaddr(traced_process);
getdata(traced_process, addr, backup, len);
putdata(traced_process, addr, insertcode, len);
memcpy(&oldregs, ®s, sizeof(regs));
regs.eip = addr;
ptrace(PTRACE_SETREGS, traced_process,
NULL, ®s);
ptrace(PTRACE_CONT, traced_process,
NULL, NULL);
wait(NULL);
printf("The process stopped, Putting back "
"the original instructions\n");
putdata(traced_process, addr, backup, len);
ptrace(PTRACE_SETREGS, traced_process,
NULL, &oldregs);
printf("Letting it continue with "
"original flow\n");
ptrace(PTRACE_DETACH, traced_process,
NULL, NULL);
return 0;
}
那么现在内核中发生了什么?ptrace 是如何实现的?本节本身可以是一篇文章;但是,这里简要描述一下发生了什么。
当进程使用 PTRACE_TRACEME 调用 ptrace 时,内核会设置进程标志以反映它正在被跟踪
Source: arch/i386/kernel/ptrace.c
if (request == PTRACE_TRACEME) {
    /* are we already being traced? */
    if (current->ptrace & PT_PTRACED)
        goto out;
    /* set the ptrace bit in the process flags. */
    current->ptrace |= PT_PTRACED;
    ret = 0;
    goto out;
}
当完成系统调用入口时,内核会检查此标志,如果正在跟踪进程,则调用跟踪系统调用。可以在 arch/i386/kernel/entry.S 中找到详细的汇编细节。
现在,我们在 arch/i386/kernel/ptrace.c 中定义的 sys_trace() 函数中。它停止子进程并向父进程发送信号,通知子进程已停止。这会唤醒等待的父进程,并执行 ptrace 魔法。一旦父进程完成,并且它调用 ptrace(PTRACE_CONT, ..) 或 ptrace(PTRACE_SYSCALL, ..),它会通过调用调度程序函数 wake_up_process() 唤醒子进程。其他一些架构可以通过向子进程发送 SIGCHLD 来实现这一点。
ptrace 对于某些人来说可能看起来很神奇,因为它能够检查和修改正在运行的程序。它通常被调试器和系统调用跟踪程序(例如 ptrace)使用。它为进行用户模式扩展也开辟了有趣的可能性。已经有很多尝试在用户级别扩展操作系统。请参阅“资源”以阅读有关 UFO(文件系统的用户级扩展)的信息。 ptrace 也用于采用安全机制。
本文和第一部分中的所有示例代码都可以在 Linux Journal FTP 站点上的 tar 存档中找到 [ftp.linuxjournal.com/pub/lj/listings/issue104/6210.tgz]。

Pradeep Padala 目前正在佛罗里达大学攻读硕士学位。他的研究兴趣包括网格和分布式系统。可以通过电子邮件 p_padala@yahoo.com 或通过他的网站 (www.cise.ufl.edu/~ppadala) 与他联系。

